BP Review Shows Flat Year for Gas
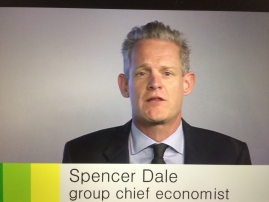
BP's chief economist Spencer Dale (pictured, below) presented the company's Statistical Review 2016, the 66th edition, June 13, saying it "shone a light on both factors driving energy markets in 2016: short-run adjustments and long-run transition.“
As well as responding to the long-term transition towards low carbon energy, markets last year also had to respond to a series of shorter-run factors. This was most notable in the oil market, which continued to adjust to the excess supply that has weighed on prices over the past three years.
Opening the presentation, deputy group CEO Lamar McKay said the key features of 2016 can be summed up as follows:
- Primary energy grew by just 1% in 2016, almost half the average rate seen over the previous 10 years – this is the third consecutive year in which energy consumption has grown by 1% or less;
- Renewables was the fastest growing energy source, up 12% in 2016, accounting for nearly a third of the increase in primary energy despite having a share of only 4%, but coal fell sharply for the second year by 1.7%;
- Weak demand growth and gains in energy efficiency meant that carbon emissions remained flat in 2016, for the third year in a row, but a contributor to this may be the slowdown in China’s economy.
While the oil market has been adjusting to excess supplies, the natural gas market was relatively muted in 2016. Global demand rose by 1.5%, weaker than its 10-year average of 2.3%. Global gas production was flat, up 0.3% – the weakest growth in gas output for almost 35 years, other than in the immediate aftermath of the financial crisis.
However, gas demand in Europe rose strongly – 5.9% – helped by both the increasing competitiveness of gas relative to coal, and weakness in European nuclear and renewable energy. Henry Hub prices were about 5% lower than in 2015, but European and Asian spot prices were down by 20% to 30%.
LNG production grew rapidly, with global supplies set to increase by around a further 30% by 2020, equivalent to a new LNG train coming on stream every two months until the end of this decade. In addition to low prices, this is leading to a shift towards more flexible trading, shorter and smaller contracts and increased spot trading.

(Credit: BP)
Increasing availability of LNG supplies has prompted a number of new countries, including Egypt, Pakistan and Poland, to enter the market in the past couple of years.
Europe’s access to plentiful supplies of pipeline gas, particularly from Russia, means that LNG imports are facing stiff competition. In terms of this battle of competing supplies – if one can call it a battle – 2016 went to pipeline gas. Russia has a strong incentive to compete to maintain its market share in the face of growing structural competition from LNG supplies. However, Europe has the option of importing LNG as and when the need arises.
The growth of gas, and coal, has been squeezed by the increasing contribution from renewable energy. One noticeable weak spot last year, though, was the EU, where renewable energy barely grew as load factors in both wind and solar fell back from unusually high levels in 2015. The experience of the EU last year is a reminder of the variability that weather conditions can inject into renewable energy generation from year to year.
What was notable in terms of the long-term transition towards low carbon energy, is that 2016 was the third consecutive year of weak growth in global energy demand and little or no growth in carbon emissions.
Russia is top dog
BP said Russia has maintained the first place in the world in terms of export volumes of oil and pipeline gas, accounting for 13.2% of the former and 18.9% of the latter. Russia produced 11.227mn barrels of oil/day, or 2.2% more than it did in 2015. Russia is the third largest producer after the US (12.354mn b/d) and Saudi Arabia (12.349mn b/d). Russia's share in world oil production is 12.2%.
Exports of oil from the Russian Federation averaged 8.634mn b/d, up 2.1% from 2015.
Gas production in Russia grew by just half a percentage point, to 579.4bn m³, which is about a sixth of the world's total. The biggest was the US with 749.2bn m³.
Gas exports from Russia amounted to 190.8bn m³ of which 14bn m³ were LNG, followed by Norway with 109.8bn m³. Qatar exported 104.4bn m³, mostly as LNG.
The figures in the BP review are close to those published by the energy ministry of energy, the central dispatching unit and Rosstat, but there are discrepancies perhaps owing to different measuring standards.
Charles Ellinas, Azerbaijan desk


