[NGW Magazine] Gas Must Look to its Laurels: IEA
This article is featured in NGW Magazine Volume 2, Issue 20
By Charles Ellinas
The trade-off between sustainability, price and reliability is becoming less clear-cut as renewables now ticks the first two objectives and coal ticks the second two. Gas has its work cut out.
A number of energy outlooks published this year by BP, EIA and DNV GL forecast natural gas demand to continue to rise over the next 20 to 30 years, supported by low cost and the drive for cleaner fuels. But the fast penetration of renewables and coal, which is stubbornly maintaining its role in power generation, particularly in Asia, pose serious threats.
Even if renewables are not yet at the stage where they can transform the entire energy business, they are becoming very disruptive in electricity markets.
A new market report just released by the International Energy Agency (IEA), ‘Renewables 2017’, highlights some of the challenges natural gas faces. This is a much more bullish report on the impact of renewables in comparison with earlier IEA reports, where it has been criticised for significantly underestimating the future output of especially from wind.
This shows new records for renewable energy, which accounted for two-thirds of all global net electricity capacity growth in 2016 and this is expected to increase further over the next five years, the forecast period of this report. The cost of solar PV and onshore wind is now comparable or even lower than new-build fossil fuel alternatives. This is attracting the interest of emerging economies, which are now looking at renewables as attractive options to sustain their development.
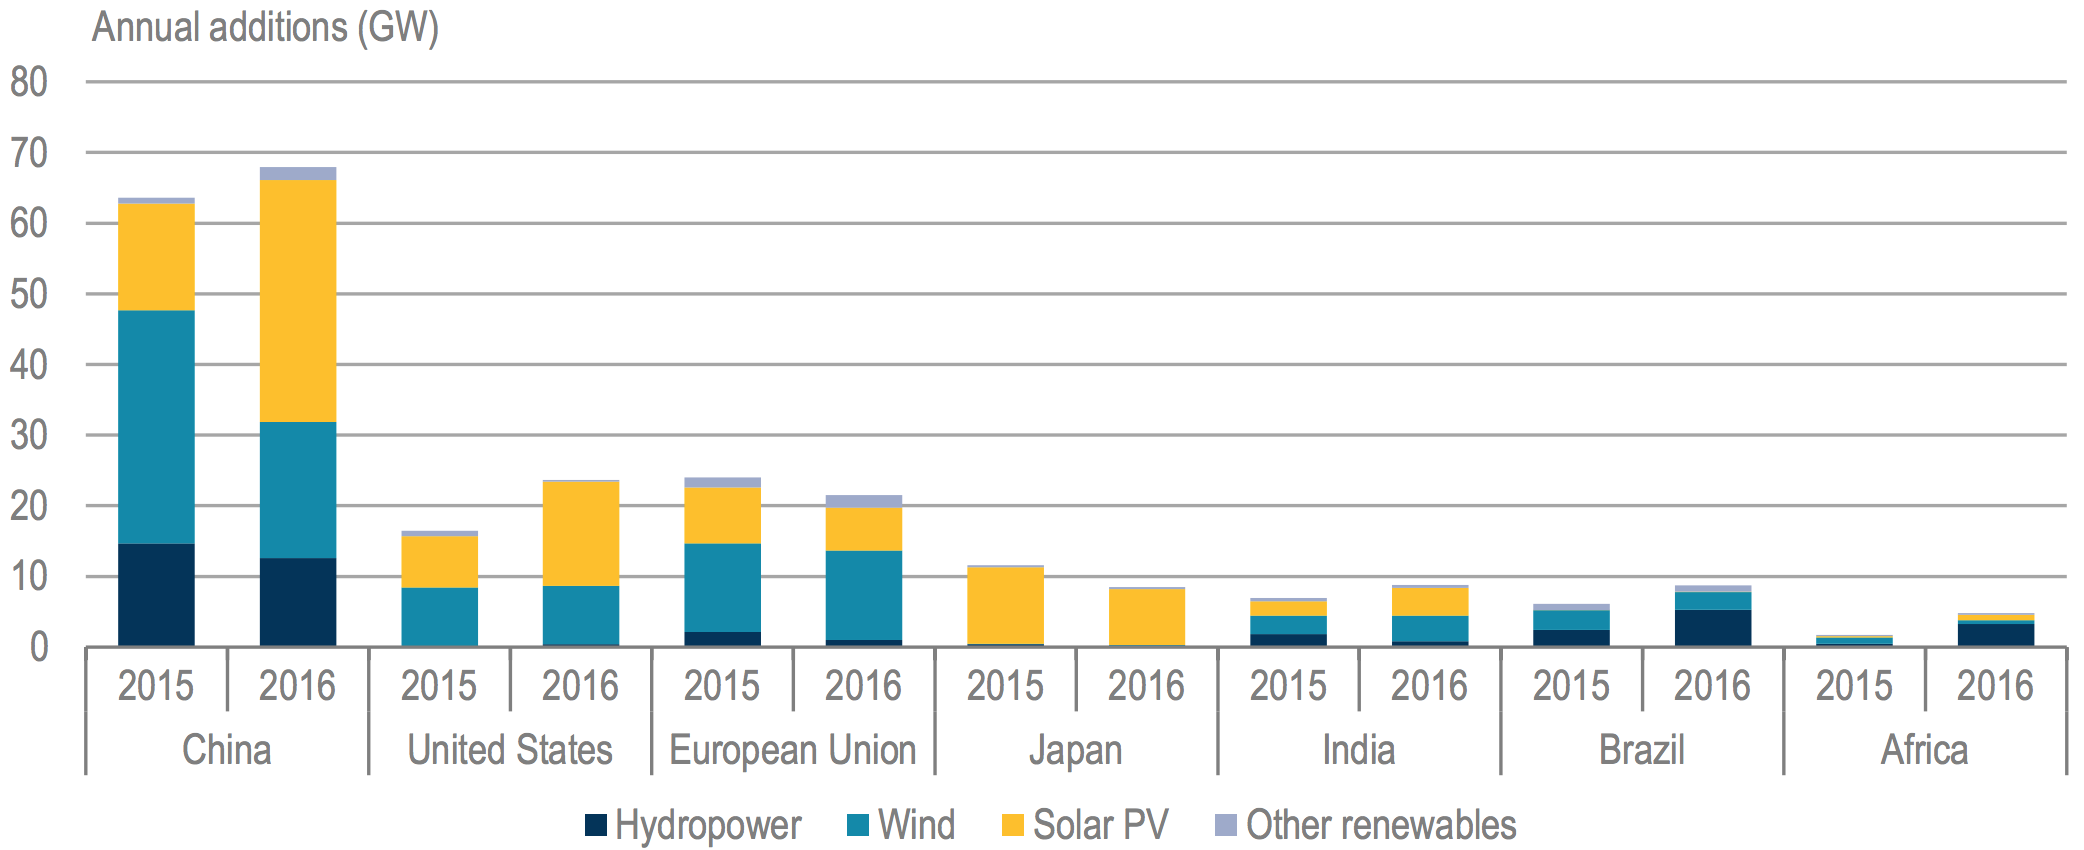
China has now become the undisputed leader in renewable energy (Figure 1). It is also becoming a market leader, creating a strong renewables manufacturing industry that is producing a dramatic reduction in costs. India is also about to overtake the EU in renewable electricity capacity growth for the first time. And despite policy uncertainty, the US remains the second-largest growth market for renewables, driven by federal tax incentives and strong state-level policies.
Figure 1: Renewable capacity additions in 2015 and 2016
Source: US Energy Information Administration (EIA)
But the surprise is that in the EU, renewable growth over the forecast period is 40% lower compared with the previous five years. Overall, weaker electricity demand and overcapacity stand in the way of growth. The exception is Denmark, which by 2022 is expected to be the world leader, with almost 70% of its electricity generation coming from variable renewables.
This trend started in 2016. The EU and Japan were the only two major economies where renewable capacity additions declined between 2015 and 2016 (Figure 1).
The good news is that the growth in solar PV helps to bridge the electrification gap in developing Asia and sub-Saharan Africa.
Over the forecast period, domestic solar systems will bring basic electricity services to almost 70mn more people in these regions – an important socio-economic contribution.
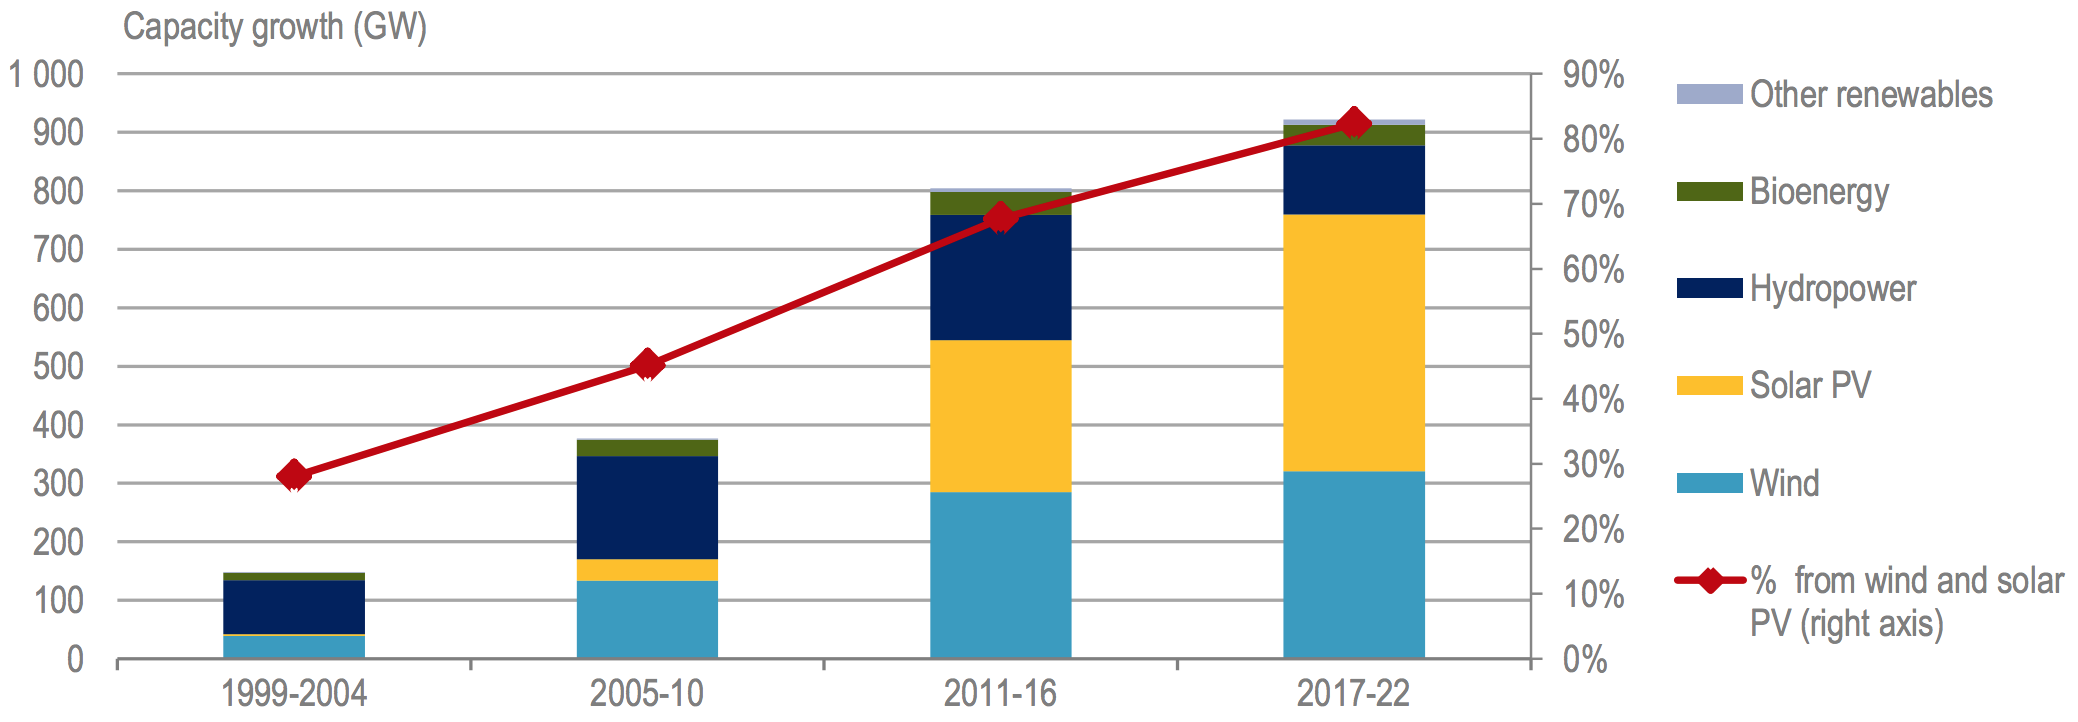
Wind and solar together will represent more than 80% of global renewable capacity growth in the next five years, if the IEA is right. And as growth of wind and solar accelerates, system integration becomes increasingly important.
As IEA CEO Fatih Birol observes: “This is why system integration of renewables is becoming so critical. In many countries, market design and policy frameworks will need to evolve to integrate growing shares of variable renewables while ensuring electricity security at all times. This will require increasing the flexibility of power systems through better grids and interconnections, more flexible power plants, affordable storage and demand-side response.”
While undoubtedly these developments are good news for renewables, the poor relation is natural gas. Net electricity capacity additions from natural gas were the lowest of all fuels in 2016, only half of coal and a sixth of renewable energy capacity additions. There were also significant power plant retirements in 2016: 12 GW gas and 26 GW coal. In other words, natural gas in power generation is being squeezed by cheap coal and subsidised renewables.
But more capacity does not mean more output where non-despatchable renewables are concerned. Given that the forecasts in IEA’s report are for just five years, they have a better chance of being accurate than the long-term scenarios in the BP, EIA and DNV GL Outlooks. For this reason, the IEA forecast impact of renewables on natural in electricity generation merits serious consideration.
As a recent article in the FT states: “Renewables are no longer an afterthought in the energy business. They are a growing, competitive sector in their own right, and a source of disruption and risk to the incumbents,”– ie, coal and natural gas.
Solar PV leads the way
The IEA headline is ‘solar leads the charge in another record year for renewables’, with solar capacity growing much faster than any other fuel (Figure 2).
Figure 2: Global net renewable capacity by technology
Source: IEA
For the first time, solar PV capacity is growing faster than hydro and wind. It is predicted to carry on doing so at least over the next five years.
This is driven by continuous policy support and cost reductions
But it is this policy support that is now causing challenges in China, which represents half of the global solar PV demand.
It faces two important challenges: the growing cost of renewable subsidies; and grid integration.
These are being addressed but they are limiting forecast growth.
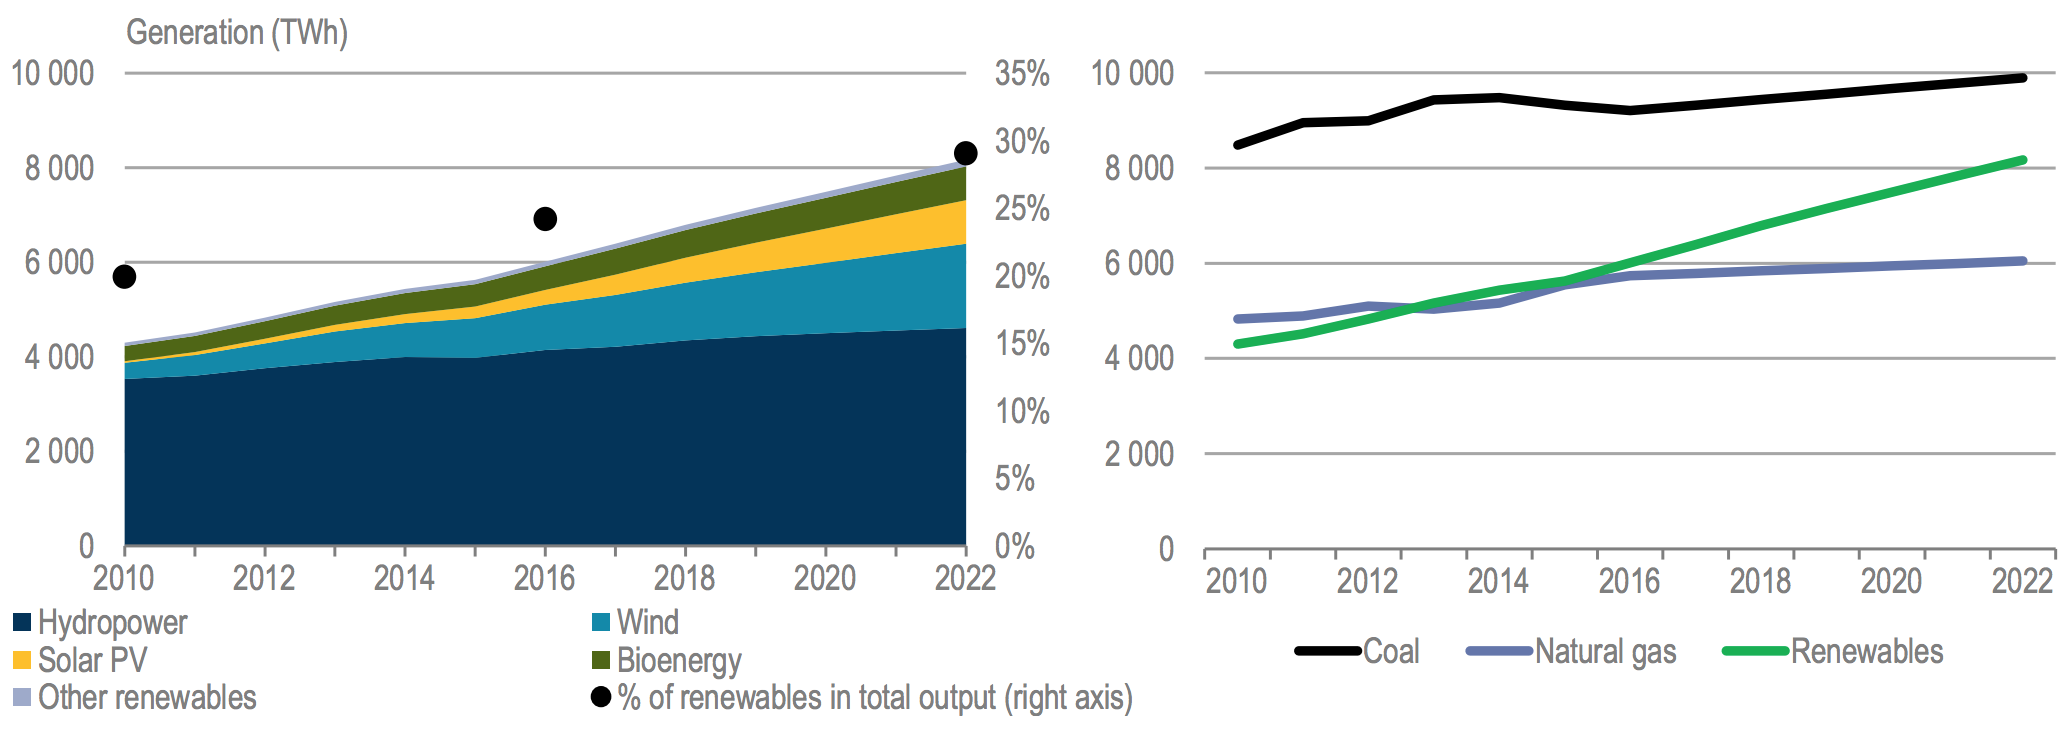
Renewable electricity generation is anticipated to grow by 36% over the forecast period, with its share of the global power mix increasing from 24% in 2016 to reach 30% by 2022.
But despite slower capacity growth, by far the biggest contribution to renewable generating capacity is from hydro followed by wind, (Figure 3). Hydro should not be underestimated as it still has huge potential in Asia and Africa.
Figure 3: Global electricity generation by fuel
Source: IEA
Impact on natural gas and coal
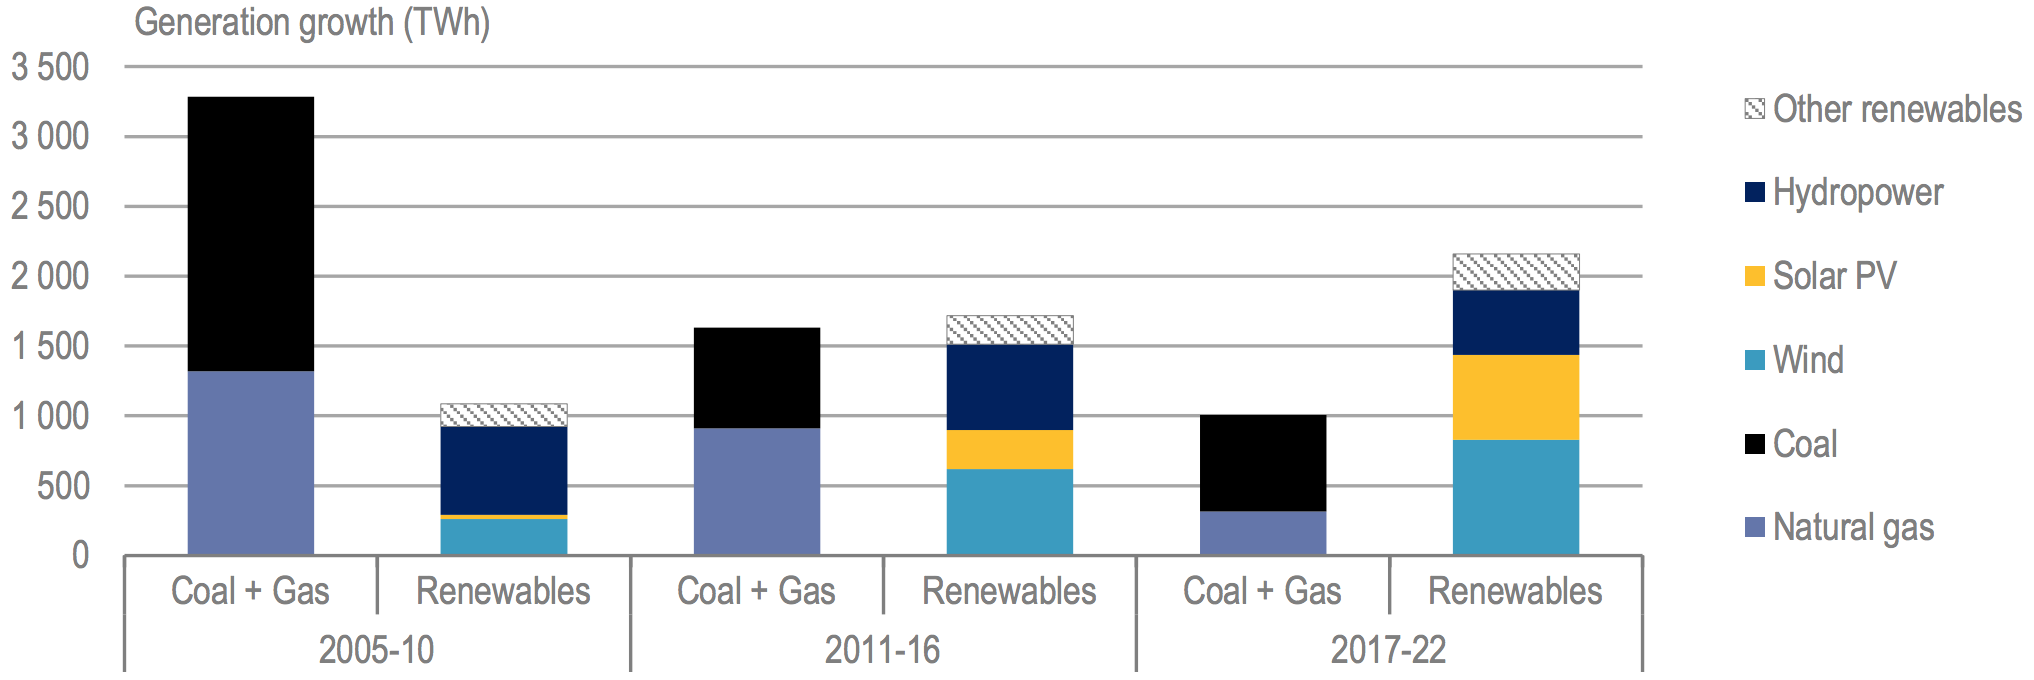
Over the forecast period, growth in renewable generation will be twice as large as that of gas and coal combined. While coal remains the largest source of electricity generation in 2022, renewables close in on its lead. In 2016, renewable generation was 34% less than coal but by 2022 this gap will be halved to just 17%.
However, the same cannot be said for gas. Growth of natural gas in power generation remains anaemic over the reference period, slower than that from coal and the gap is widening.
Interestingly, between 2014 and 2016 coal fired power generation declined, but since then and over the reference period it is on the ascendance.
The contribution from renewables to global electricity generation has already surpassed that from natural gas and by 2022 it will be one-third bigger. The impact of renewable growth in net electricity generation over fossil fuels is clear (Figure 4).
Figure 4: Renewable and fossil fuel growth in net electricity generations
Source: IEA
The contribution from fossil fuels and renewables to the total electricity additions in each of the five-year periods is summarized in Table 1.
Table 1: Contribution from fossil fuels and renewables to total electricity additions in five-year periods
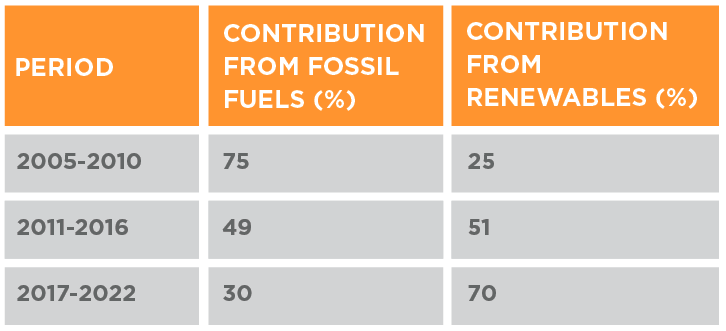
It is a remarkable transition, with the contribution from fossil fuels declining rapidly, while the contribution from renewables increases dramatically. Fossil fuel additions dominated in 2005 to 2010, but over the forecast period renewable additions take the dominant role. The relative contribution from coal and natural gas during the last 5-year period should also be of concern to gas. While in the 2011 to 2016 period gas additions accounted for 56% of fossil fuel electricity generation and coal 44%, by 2022 gas will contribute only 30% and coal 70% (Figure 4).
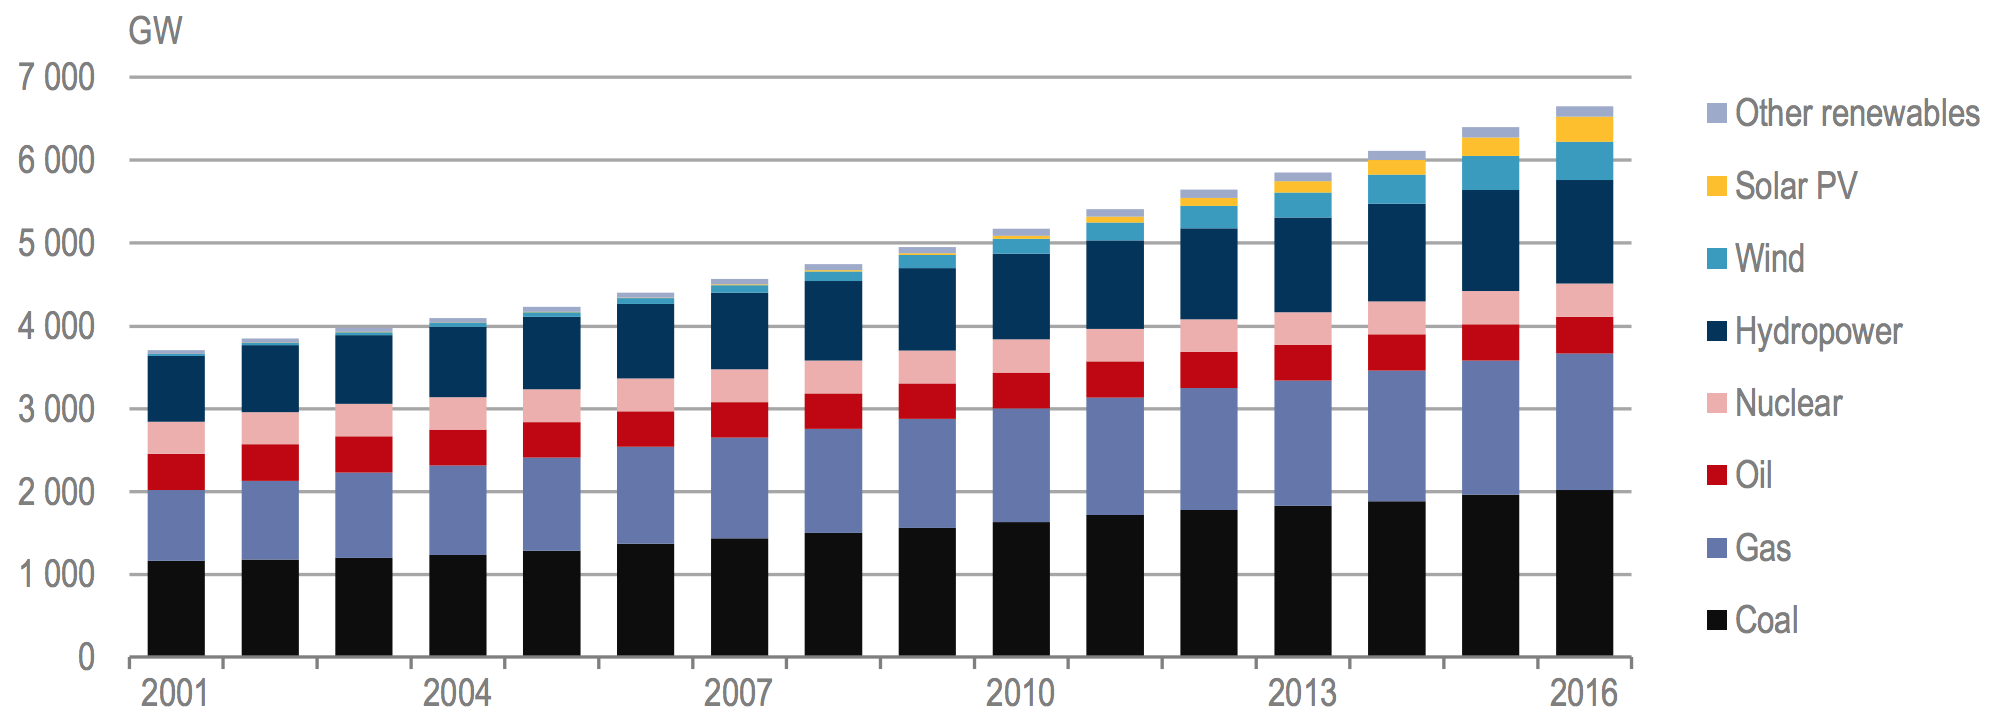
Bad news for natural gas? More worrying than bad. Gas-fired power generation will still be increasing, albeit at slow rates. As a result, gas still is one of the main fuels in global electricity generation (Figure 5). Even though in 2016 renewables were the largest source of cumulative capacity at 2,135 GW, followed by coal at 2,020 GW, natural gas was still third, providing 1,650 GW. The contribution from oil was 445 GW and from nuclear 400 GW.
Figure 5: Fuel contribution to total global electricity capacity
Source: IEA
Renewable policies
The IEA says that renewable policies in many countries are moving from government-set tariffs to competitive auctions with long-term power purchase agreements (PPAs) for utility-scale projects. In some countries, increased competition has reduced remuneration levels for solar PV and wind projects by 30% to 40% in just two years. This has squeezed costs along the entire value chain making tenders a cost-effective policy option for governments.
The IEA adds that auctions can also enable a better control of deployment, total incentives, and system integration aspects. Almost half of the renewable electricity capacity expansion over the reference period is expected to be driven by competitive auctions with PPAs, in contrast to just over a fifth in 2016.
Auctions are also proving effective in rapidly reducing costs of offshore wind and concentrated solar power (CSP). Auctions suggest that expanding competitive pricing could result in even lower average costs in coming years, but this remains to be seen.
Recently announced contract prices for solar PV and wind power purchase agreements are becoming increasingly comparable or lower than generation cost of newly built gas and coal power plants.
However, with wind and solar together expected to represent more than 80% of global renewable capacity growth in the next five years, without increases in system flexibility variable renewables become more exposed to risk. Market and policy frameworks need to evolve in order to cope with this. However, the role of renewables has the potential to be strengthened even further if storage technology solves the problem of intermittency.
Implications for natural gas
If these policies do indeed result in even lower renewable costs, the impact on fossil fuel contribution to electricity generation could be even more dramatic. With coal retaining its position, this impact is likely to be stronger on gas.
So, apart from lowering gas prices even further and counting on China to lead gas demand growth, what else can be done to boost the use of natural gas? One key remaining option is to increase carbon pricing to levels which can have a meaningful impact on the price of coal relative to gas. But apart from Europe, would such policies gain ground elsewhere? Experience shows that this would be a challenge. Coal becomes vulnerable mostly where emissions are regulated, such as in the European Union.
There is a risk that carbon pricing may help renewables even further at the expense of gas, which of course is another carbon emitting fossil fuel. But as it is only half as bad as coal in that respect, and has practically none of the latter’s particulates that seriously damage health, air pollution and environmental concerns in China and India have the potential to reduce reliance on coal and so increase gas demand. Lower natural gas prices have helped open up new markets. Maintaining lower costs or even lowering them further will be a challenge, but may become important if gas is to compete against coal and renewables. This was highlighted by Yuji Kakimi, the head of Japan’s energy trader Jera, who warned producers that they needed to become more competitive on price if they want to usher in a ‘golden age’ of gas in Asia. He said “Compared to coal, as a fuel source for electricity, gas is about 1.5 times more expensive, even at $6/mn Btu. Can emerging markets, which are looking to grow, really push for environment over economics? At $10…it isn’t economically competitive at all.”
But even though lower prices have contributed to the creation of more demand, they are challenging developers and suppliers and of course sanctioning of new LNG plant, especially large greenfield liquefaction projects. As a result, emphasis is shifting to brownfield expansions, but also to smaller, modular LNG projects, especially in the US. These may lead the next wave of LNG liquefaction.
Wider use of FSRUs has helped the spread of LNG, especially in Asia. Partnering with local companies and investing in LNG import terminals and downstream projects may also help bolster LNG sales. This may also include investing upstream, as Tellurian is doing by buying into the Haynesville natural gas assets in the US. Natural gas has to adapt and compete in the new electricity market environment if it is to realize its potential as the cleaner fossil fuel, driven by abundance of resources.
Charles Ellinas


